INTERNET TEACHING LAB: TOPOLOGY DISCOVERY
INSTRUCTOR VERSION
Overview
Each team has a set of computers on its own ethernet VLAN connected to a working lab network of six Cisco routers. Your task is to configure the TCP/IP protocol on your computers and verify you can communicate between your PCs, with other team PCs, the routers, and systems outside the lab on the Internet. Once you have basic connectivity, your job is to download and use network tools to discover the IP addressing scheme and network topology of the lab network. You will be given hints but no login access to the routers for this assignment. Your journal should detail how you discovered different aspects of the addressing scheme and topology and include a detailed network diagram showing the routers, connections between routers, bandwidth of the connections, and IP addresses for all router interfaces, including where the team VLANs attach to the lab network.
Hints
For this exercise inside the lab network, we will be using RFC1918 private address space for all router and computer interfaces. The only exceptions are a single real address on router FW/R6 which is performing network address translation (NAT) to allow lab computers to access the Internet for downloading files, and a special UNIX server with two ethernet ports. The special UNIX server does not route, but you can TELNET in from outside the lab, then TELNET to your team computers, allowing indirect access.
The six Cisco routers are running the IOS operating system and intentionally have many of the security features disabled to make your job easier. The routers connect to each other through different physical network media at different bandwidths. All layer 3 networks use a 24 bit network mask. Several router features that might normally be disabled have been turned on such as “service tcp-small-servers”, “ip directed-broadcast”, and “ip source-route”. SNMP is enabled on all routers with a read-only community string “public”.
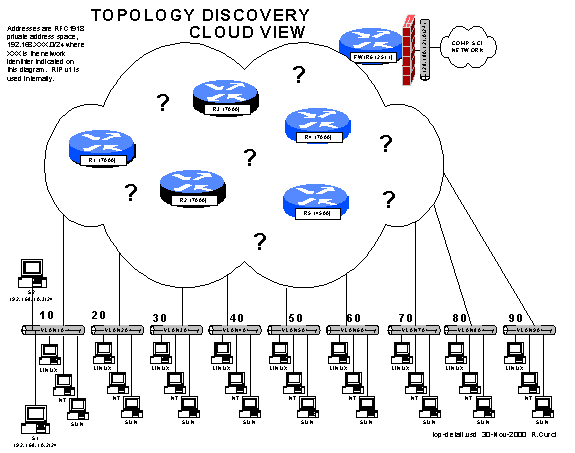
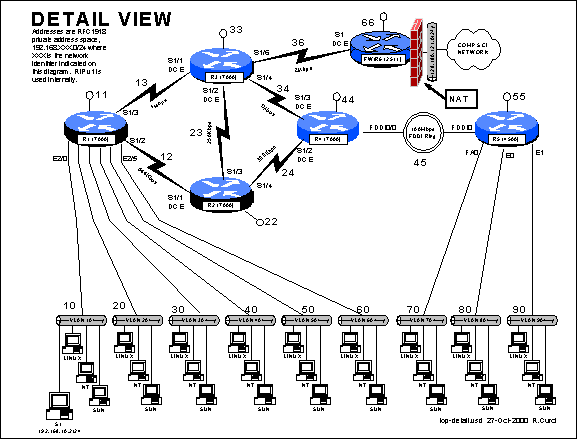
The goal of this assignment is to figure out the network topology and build a detailed map like this (drawing on file top-detail.vsd). I have left off many of the IP addresses to make this drawing more legible. Interfaces on links between routers have the last octet equal to the router number. Networks for links between routers are the router numbers catenated with smaller number first. User ethernet LAN segments use are numbered in the 10s with last octet equal to “.1”.
 foo
foo
PART1 – GETTING STARTED:
Address your team computers using the following table by replacing TEAM with your integer team number:
|
LINUX |
192.168.X.Y |
X= 10 * TEAM |
Y= X + 1 |
|
NT |
192.168.X.Y |
X= 10 * TEAM |
Y= X + 2 |
|
SOLARIS |
192.168.X.Y |
X= 10 * TEAM |
Y= X + 3 |
For example, team 5’s NT system should be addressed with 192.168.50.52/24.
To test basic connectivity, verify you can PING(1) each of the other teams’ local gateway IP address.
On each of your computers, install the RIP version 1 routing protocol. Under UNIX, you can use either GateD or RouteD in passive mode. Under NT 4.0, use “RIP for Internet Protocol”. Your computers should learn a list of routes including a special “default route” sometimes abbreviated “0.0.0.0”. Make sure you have removed any static default routes and are learning the default dynamically. Build a table of routes including the RIP metric. This metric indicates the number of router hops from your computer to each of the networks and will help in figuring out the topology.
Hint: The UNIX utility ripquery(1) may be helpful.
Under NT 4.0 Server, you can use Network Control PanelàServicesàAddàRIP for Internet Protocol to add RIP protocol. You can display the routing table with either “netstat –rn” or “route print”:
NT40> route print
===========================================================================
Active Routes:
Network Destination Netmask
Gateway Interface Metric
127.0.0.0 255.0.0.0 127.0.0.1 127.0.0.1 1
192.168.10.0
255.255.255.0
192.168.10.43 192.168.10.43 1
192.168.10.43
255.255.255.255
127.0.0.1 127.0.0.1 1
192.168.10.255
255.255.255.255
192.168.10.43 192.168.10.43 1
192.168.20.0 255.255.255.0 192.168.10.200
192.168.10.43 2
192.168.30.0
255.255.255.0 192.168.10.200 192.168.10.43 2
192.168.40.0 255.255.255.0 192.168.10.200
192.168.10.43 2
224.0.0.0 224.0.0.0 192.168.10.43 192.168.10.43 1
255.255.255.255
255.255.255.255
192.168.10.43 192.168.10.43 1
===========================================================================
I did notice what appears to be a bug in how NT 4.0 server’s RIP implementation works. Although it did pick up the ordinary routes announced by the Cisco router with RIP v1, it refused to pick up the default route, even though the Cisco debug mode clearly showed it was getting announced with a valid metric.
Under RedHat Linux 6.2, you can start gated in passive mode like this:
echo “rip yes;” >/etc/gated.conf
/etc/rc.d/init.d/*gated start
You can display the routing table with “netstat –rn”, however, it does not show the metrics. You can find the PID of your gated process with “ps –aux | grep gated” and send it an INT signal “kill –SIGINT xxxx”. This will dump the current state of the gated process to /var/gated/gated_dump. Inside the dump file is information on the RIP routes including the metrics:
Sample Linux
/var/gated/gated_dump file excerpt:
Routing table for
inet (2):
Destinations: 7 Routes: 7
Holddown: 0 Delete:
1 Hidden: 0
0.0.0.0 mask 0.0.0.0
entries 1 announce
1
TSI:
*RIP Preference:
100
NextHop: 192.168.10.200 Interface: 192.168.10.50(eth0)
State: <Int Active Gateway>
Age: 2 Metric:
5 Metric2: 0 Tag: 0
Task: RIP.0.0.0.0+520
Announcement bits(1): 2-KRT
AS Path: IGP (Id 1)
192.168.10 mask 255.255.255
entries 1 announce
1
TSI:
*Direct Preference: 0
NextHop: 192.168.10.50 Interface:
192.168.10.50(eth0)
State: <Int Active Retain>
Age: 2 Metric:
0 Metric2: 0 Tag: 0
Task: IF
Announcement bits(1): 2-KRT
AS Path: IGP (Id 1)
192.168.20 mask 255.255.255
entries 1 announce
1
TSI:
*RIP Preference:
100
NextHop: 192.168.10.200 Interface: 192.168.10.50(eth0)
State: <Int Active Gateway>
Age: 2 Metric:
2 Metric2: 0 Tag: 0
Task: RIP.0.0.0.0+520
Announcement bits(1): 2-KRT
AS Path: IGP (Id 1)
RIPQUERY(1) was certainly the easiest tool to get a list of the local gateway’s RIP routing announcements. The flag ‘-1’ indicates RIP v1, ‘-r’ to use a RESPONSE packet, and ‘-n’ to display the results numerically:
[root@s1 ripquery]# ripquery
-1 -r -n 192.168.10.1
424 bytes from 192.168.10.1
version 1:
0.0.0.0 metric 7
192.168.70.0 metric 4
192.168.90.0 metric 4
192.168.80.0 metric 4
192.168.40.0 metric 1
192.168.44.0 metric 3
192.168.45.0 metric 3
192.168.33.0 metric 2
192.168.34.0 metric 2
192.168.36.0 metric 2
192.168.60.0 metric 1
192.168.50.0 metric 1
192.168.55.0 metric 4
192.168.11.0 metric 1
192.168.12.0 metric 1
192.168.13.0 metric 1
192.168.24.0 metric 2
192.168.30.0 metric 1
192.168.20.0 metric 1
192.168.22.0 metric 2
192.168.23.0 metric 2
[root@s1 ripquery]#
PART2 – FIND THE SIX ROUTERS:
Given the network list from part 1, PING(1) the broadcast address for each network you found above. Normally, you will hear responses from the IP address of the router interface closest to your computer connected to the destination network. If you see more than one IP address in the responses, it is an indication that there are multiple routers on the broadcast network with different paths back to your computer.
Linux# ping –b –n 192.168.12.255
PING 192.168.12.255 (192.168.12.255) from 192.168.10.2 : 56(84) bytes of data.
64 bytes from 192.168.10.1: icmp_seq=0 ttl=255 time=2.9 ms
64 bytes from 192.168.12.2: icmp_seq=0 ttl=254 time=41.2 ms (DUP!)
64 bytes from 192.168.10.1: icmp_seq=1 ttl=255 time=2.9 ms
64 bytes from 192.168.12.2: icmp_seq=1 ttl=254 time=12.2 ms (DUP!)
64 bytes from 192.168.10.1: icmp_seq=2 ttl=255 time=2.8 ms
…
Use the TRACEROUTE(1) utility to find some of the connections between the routers. (This utility is named TROUTE.EXE under NT). For each lab network, select an IP address and trace the route to it, making a note of the IP addresses of the routers in the path. Be sure to trace the route toward the Internet by tracing to a computer science server outside the lab. You should be able to find an IP address for each of the six routers. Note that routers generally have multiple interfaces each with its own IP address, so you may find multiple IP addresses that belong to the same router.
# Tracing
the router to each network (use last octet = .1),
# you will
find the six routers: (Your IP address
may vary between
# teams
but will represent the same six routers)
[root@s1 top]#
traceroute 192.168.66.1
traceroute to
192.168.66.1 (192.168.66.1), 30 hops max, 38 byte packets
1 192.168.10.1
(192.168.10.1) 2.502 ms 2.015 ms
2.073 ms
2 192.168.13.3
(192.168.13.3) 3.538 ms 3.504 ms
3.431 ms
3 192.168.36.6
(192.168.36.6) 7.589 ms 7.113 ms
6.371 ms
...
It would have been neat to experiment with the traceroute ‘-g’ option and enable “ip source-route’ to experiment with IP source routing, but there seems to be a bug in traceroute that generates an error message. When source routing is honored, it allows you to manually route the traceroute packets through a remote router so you can see, for example, the path from the remote router to you. This is handy since many times Internet routing is asymmetric. Linux RedHat 6.2 includes traceroute v1.4a5. Downloading the latest Van Jacobson code from ftp.ee.lbl.gov (version 1.4a7) had the same problem.
Download install the NMAP(1) utility for UNIX. You can find it at www.insecure.org/nmap. Use this tool to scan the 192.168.0.0/16 address space to find all devices and attempt to guess their operating systems. Be careful not to scan outside the 192.168.0.0/16 lab network as most System Administrators treat scanning as an attack and will likely trigger many intrusion detection alarms. Under Florida Law, port scanning is treated as unauthorized intrusion.
This tool allows scanning of the entire 192.168.0.0/16 address space in about 25 minutes. Normally, you would see the student PCs as well, but my test environment has only the S1 Linux box at 192.168.10.2:
Linux# nmap -v -sS -O
192.168.0.0/16 | egrep '(^Host|^Remote operating)' |
grep -v broadcast | grep -v
skip
Host (192.168.10.1) appears to be up ... good.
Remote operating system guess: IOS
Version 10.3(15) - 11.1(20)
Host (192.168.10.2) appears to be up ... good.
Remote operating system guess: Linux
2.1.122 - 2.2.14
Host (192.168.10.200) appears to be up ... good.
Host (192.168.11.1) appears to be up ... good.
Remote operating system guess: IOS
Version 10.3(15) - 11.1(20)
…
The IP addresses for the router loopback addresses are probably the easiest to remember for R1, R2, R3, R4, R5, R6 à 192.168.XX.X where X = {1,2,3,4,5,6}.
PART4 – Simple Network Management Protocol (SNMP)
All of the lab routers will respond to SNMP version 1 queries. SNMP version 1 uses a simple password protection scheme called a “community”. Each router is programmed to be an SNMP “agent” and will respond to the read-only community string “public”. SNMP agents store data in a Management Information Base, or MIB. The MIB contains a lot of information including the router name, the uptime, software version, interface names, interface IP addresses, routing tables, etc. Many SNMP tools are available for Linux:
snmpbulkget snmpget snmpset
snmptest snmpusm
snmpbulkwalk snmpgetnext
snmpstatus snmptranslate snmpwalk
snmpdelta snmpnetstat snmptable
snmptrap
For example, you can display individual MIB variables with SNMPGET(1):
LINUX$ snmpget
192.168.10.1 public system.sysDescr.0
system.sysDescr.0 = Cisco
Internetwork Operating System Software
IOS (tm) GS Software
(GS7-J-M), Version 11.1(24), RELEASE SOFTWARE (fc1)
Copyright (c) 1986-1999 by
cisco Systems, Inc.
Compiled Mon 04-Jan-99
21:19 by richv
LINUX$
The most useful utilities here are:
Snmpget(1) à get individual MIB variables
Snmpwalk(1) à get a subtree of the MIB, or the whole thing
Snmpnetstat(1) à get stats or routing table in a format similar to netstat(1)
For each of your routers, look up the following MIB variables:
system.sysDescr.0
system.sysName.0
This will let you see the router names to eliminate any duplicates if you previously found more than one IP address for the same router. Using the system description, note the IOS software version of the router. You should now have enough information to draw a diagram of the six routers with the interface names, interface types (ethernet, fddi, point-to-point, loopback), how they connect to each other, and the IP addressing scheme.
# For each
router, get the SNMP name and software version:
#
[root@s1
top]# snmpget -v 1 192.168.11.1 public system.sysDescr.0
system.sysDescr.0
= Cisco Internetwork Operating System Software
IOS (tm) GS
Software (GS7-J-M), Version 11.1(24), RELEASE SOFTWARE (fc1)
Copyright (c)
1986-1999 by cisco Systems, Inc.
Compiled Mon
04-Jan-99 21:19 by richv
[root@s1
top]# snmpget -v 1 192.168.11.1 public system.sysName.0
system.sysName.0
= r1
#
# You can
get the interface names along with their network address,
# IP
address, and I/O stats:
#
[root@s1
top]# snmpnetstat -v 1 192.168.11.1 public -i
Name Mtu Network Address Ipkts Ierrs Opkts Oerrs Queue
Ethernet2/0 1500 192.168.10 192.168.10.1 52747 0 55401 0 0
Fddi0/0 4470 37214
0 14071 0 0
Loopback0 1500 192.168.11 192.168.11.1 0
0 4453 0 0
Serial1/0* 1500 0
0 0 0 0
Serial1/2
1500 192.168.12 192.168.12.1
29853 0 27062 0
0
Serial1/1* 1500 0
0 0 0 0
Serial1/3 1500 192.168.13 192.168.13.1 36097 0 38371 0 0
Ethernet2/1 1500 192.168.20 192.168.20.1 0 0 6705 0
0
Ethernet2/2 1500 192.168.30 192.168.30.1 0
0 6705 0 0
Serial1/4* 1500 0
0 0 0 0
Ethernet2/3 1500 192.168.40 192.168.40.1 0
0 6709 0 0
Serial1/5* 1500
0 0 0 0 0
Ethernet2/4 1500 192.168.50 192.168.50.1 0
0 6709 0 0
Serial1/6* 1500 0
0 0 0 0
Ethernet2/5 1500 192.168.60 192.168.60.1 0
0 6709 0 0
Serial1/7* 1500 0
0 0 0 0
#
# You can
also look at the RIP routing table on remote routers:
#
[root@s1
top]# snmpnetstat -v 1 192.168.44.4 public -rn
Routing
tables
Destination Gateway
Flags Interface
default 192.168.34.3 UG
Serial1/3
192.168.10 192.168.24.2 UG
Serial1/2
192.168.11 192.168.24.2 UG
Serial1/2
192.168.12 192.168.24.2
UG Serial1/2
192.168.13 192.168.34.3 UG
Serial1/3
192.168.20 192.168.24.2 UG
Serial1/2
192.168.22 192.168.24.2 UG
Serial1/2
192.168.23 192.168.34.3
UG Serial1/3
192.168.24 192.168.24.4 U
Serial1/2
192.168.30 192.168.24.2 UG
Serial1/2
192.168.33 192.168.34.3 UG
Serial1/3
192.168.34 192.168.34.4
U Serial1/3
192.168.36 192.168.34.3 UG
Serial1/3
192.168.40 192.168.24.2 UG
Serial1/2
192.168.44 192.168.44.4 U
Loopback0
192.168.45 192.168.45.4
U Fddi0/0
192.168.50 192.168.24.2 UG
Serial1/2
192.168.55 192.168.45.5 UG
Fddi0/0
192.168.60 192.168.24.2 UG
Serial1/2
192.168.70 192.168.45.5 UG Fddi0/0
192.168.80 192.168.45.5 UG
Fddi0/0
192.168.90 192.168.45.5 UG
Fddi0/0
[root@s1
top]# exit
# If you
are really clever, you can use SNMPWALK(1) to dump the full
# MIB and
find the interface types and bandwidth, but it can be a bit
#difficult
to find hidden in the huge amount of MIB data:
#
Linux# snmpwalk
-v 1 192.168.33.3 public interfaces.ifTable.ifEntry |
egrep -i '(admin|speed|descr|type)'
interfaces.ifTable.ifEntry.ifDescr.1
= Fddi0/0
interfaces.ifTable.ifEntry.ifDescr.2
= Serial1/0
interfaces.ifTable.ifEntry.ifDescr.3
= Serial1/1
interfaces.ifTable.ifEntry.ifDescr.4
= Serial1/2
interfaces.ifTable.ifEntry.ifDescr.5
= Serial1/3
interfaces.ifTable.ifEntry.ifDescr.6
= Serial1/4
interfaces.ifTable.ifEntry.ifDescr.7
= Serial1/5
interfaces.ifTable.ifEntry.ifDescr.8
= Serial1/6
interfaces.ifTable.ifEntry.ifDescr.9
= Serial1/7
interfaces.ifTable.ifEntry.ifDescr.10
= Loopback0
interfaces.ifTable.ifEntry.ifType.1
= fddi(15)
interfaces.ifTable.ifEntry.ifType.2
= propPointToPointSerial(22)
interfaces.ifTable.ifEntry.ifType.3
= propPointToPointSerial(22)
interfaces.ifTable.ifEntry.ifType.4
= propPointToPointSerial(22)
interfaces.ifTable.ifEntry.ifType.5
= propPointToPointSerial(22)
interfaces.ifTable.ifEntry.ifType.6
= propPointToPointSerial(22)
interfaces.ifTable.ifEntry.ifType.7
= propPointToPointSerial(22)
interfaces.ifTable.ifEntry.ifType.8
= propPointToPointSerial(22)
interfaces.ifTable.ifEntry.ifType.9
= propPointToPointSerial(22)
interfaces.ifTable.ifEntry.ifType.10
= softwareLoopback(24)
interfaces.ifTable.ifEntry.ifSpeed.1
= Gauge: 100000000
interfaces.ifTable.ifEntry.ifSpeed.2
= Gauge: 1544000
interfaces.ifTable.ifEntry.ifSpeed.3
= Gauge: 1000000
interfaces.ifTable.ifEntry.ifSpeed.4
= Gauge: 250000
interfaces.ifTable.ifEntry.ifSpeed.5
= Gauge: 1544000
interfaces.ifTable.ifEntry.ifSpeed.6
= Gauge: 1000000
interfaces.ifTable.ifEntry.ifSpeed.7
= Gauge: 1544000
interfaces.ifTable.ifEntry.ifSpeed.8
= Gauge: 2000000
interfaces.ifTable.ifEntry.ifSpeed.9
= Gauge: 1544000
interfaces.ifTable.ifEntry.ifSpeed.10
= Gauge: 3705032704
interfaces.ifTable.ifEntry.ifAdminStatus.1
= up(1)
interfaces.ifTable.ifEntry.ifAdminStatus.2
= down(2)
interfaces.ifTable.ifEntry.ifAdminStatus.3
= up(1)
interfaces.ifTable.ifEntry.ifAdminStatus.4
= up(1)
interfaces.ifTable.ifEntry.ifAdminStatus.5
= down(2)
interfaces.ifTable.ifEntry.ifAdminStatus.6
= up(1)
interfaces.ifTable.ifEntry.ifAdminStatus.7
= down(2)
interfaces.ifTable.ifEntry.ifAdminStatus.8
= up(1)
interfaces.ifTable.ifEntry.ifAdminStatus.9
= down(2)
interfaces.ifTable.ifEntry.ifAdminStatus.10
= up(1)
PART5 – Bandwidth Measurement (IPERF/PCHAR):
IPERF(1) is a tcp performance measurement tool. It is an updated version of the Test TCP program (TTCP) written by Terry Slattery in 1985 at the US Navy Ballistic Research Lab. You can find the latest version at http://dast.nlanr.net/Projects/Iperf/. You will find both UNIX source code that complies under Linux and SUNOS, and Microsoft Windows executable files (iperf.exe and iperf-threaded.exe). Normally, you start one copy of IPERF(1) in server mode, and the other in client mode specifying the server’s IP address. This utility in client mode will also work with an ordinary TCP/IP device supporting the trivial TCP DISCARD service on TCP port 9 which is enabled on all lab routers. Measure the performance from your computer to each router to help determine the bandwidth between links on your network. Note that if the packets traverse several links, the slowest link in the path will be the determining factor.
#
# IPERF(1)
tested against the router discard port tcp/9:
# Note we
get 5.3Mbps to adjacent router R1 (10Mbps CSMA/CD
#
half-duplex shared ethernet) and 0.9Mbps to
# router
R3 which is one hop furher; connection between R1
# and R3
must be approximately 0.9Mbps (1Mbps)
#
[root@s1
iperf-1.1.1]# ./iperf -c 192.168.11.1 -p 9
------------------------------------------------------------
Client
connecting to 192.168.11.1, TCP port 9
TCP window
size: 64.0 KByte (default)
------------------------------------------------------------
[ 3] local 192.168.10.2 port 2651 connected
with 192.168.11.1 port 9
[ ID]
Interval Transfer Bandwidth
[ 3]
0.0-10.1 sec 6.7 MBytes 5.3 Mbits/sec
[root@s1
iperf-1.1.1]# ./iperf -c 192.168.33.3 -p 9
------------------------------------------------------------
Client
connecting to 192.168.33.3, TCP port 9
TCP window
size: 64.0 KByte (default)
------------------------------------------------------------
[ 3] local 192.168.10.2 port 2652 connected
with 192.168.33.3 port 9
[ ID]
Interval Transfer Bandwidth
[ 3]
0.0-10.5 sec 1.2 MBytes 904 Kbits/sec
#
PCHAR(1) is a utility similar to TRACEROUTE(1), but tries to determine the bandwidth between adjacent hops in the path. It is an updated version of PATHCHAR(1) written by Van Jacobson at Lawrence Berkeley Labs, namesake of the IP Van Jacobson header compression. You will need to either change permissions on PCHAR(1) to be SUID root or execute it while logged in as root. It can be found at http://www.employees.org/~bmah/Software/pchar/ Be patient with this program as it can take a long time to run using the default settings.
#
# pchar tested from S1 192.168.10.2 to R5 (traverses R1,R2,R4,R5)
# note that this utility is unable to measure bandwidth between hops
# when an earlier hop has significantly less bandwidth. This tool is
# most useful for tracing where the initial hops have lots of bandwidth
# such as the typical case tracing the route to a device on the Internet.
#
Linux# pchar –n 192.168.55.5
pchar to 192.168.55.5 (192.168.55.5) using UDP/IPv4
Packet size increments by 32 to 1500
46 test(s) per repetition
32 repetition(s) per hop
0: 192.168.10.2 (192.168.10.2)
Partial loss: 0 / 1472 (0%)
Partial char: rtt = 1.517612 ms, (b = 0.002020 ms/B), r2 = 0.999473
stddev rtt = 0.005257, stddev b = 0.000007
Partial queueing: avg = 0.001136 ms (562 bytes)
Hop char: rtt = 1.517612 ms, bw = 3959.997825 Kbps
Hop queueing: avg = 0.001136 ms (562 bytes)
1: 192.168.10.1 (192.168.10.1)
Partial loss: 0 / 1472 (0%)
Partial char: rtt = 3.141113 ms, (b = 0.018864 ms/B), r2 = 0.999965
stddev rtt = 0.012692, stddev b = 0.000017
Partial queueing: avg = 0.001368 ms (575 bytes)
Hop char: rtt = 1.623501 ms, bw = 474.955302 Kbps
Hop queueing: avg = 0.000232 ms (13 bytes)
2: 192.168.12.2 (192.168.12.2)
Partial loss: 0 / 1472 (0%)
Partial char: rtt = 4.296151 ms, (b = 0.035639 ms/B), r2 = 0.998931
stddev rtt = 0.132170, stddev b = 0.000176
Partial queueing: avg = 0.001122 ms (575 bytes)
Hop char: rtt = 1.155038 ms, bw =
476.903053 Kbps
Hop queueing: avg = -0.000246 ms (0 bytes)
3: 192.168.24.4 (192.168.24.4)
Partial loss: 736 / 1472 (50%)
Partial char: rtt = 4.946896 ms, (b = 0.019339 ms/B), r2 = 0.999949
stddev rtt = 0.022088, stddev b = 0.000030
Partial queueing: avg = 0.006210 ms (575 bytes)
Hop char: rtt = 0.650746 ms, bw = -490.797282 Kbps
Hop queueing: avg = 0.005088 ms (0 bytes)
4: 192.168.45.5 (192.168.45.5)
Path length: 4 hops
Path char: rtt = 4.946896 ms, r2 = 0.999949
Path bottleneck: 474.955302 Kbps
Path pipe: 293 bytes
Path queueing: average = 0.006210 ms (575 bytes)
PART6 – Windows NT Network Management / WhatsUp Gold:
Download and install the utility “WhatsUp Gold” on your NT machine. You can download a 30-day evaluation copy from www.ipswitch.com. You will find both a self-installing Win95/98/NT/2000 executable and a users guide in Adobe Acrobat PDF format. If you don’t have Adobe Acrobat Reader already loaded, you can find it at www.adobe.com. As of this writing, the latest software is version 5. Test out the following tools and verify the results are consistent with your topology drawing:
- traceroute tool
- snmp tool
- scan tool
- throughput tool
How does the SCAN tool compare to the UNIX NMAP utility?
Run the throughput tool to test each router using both the ICMP and TCP/discard/port-9 modes. How do these measurements compare to each other and to tests you made earlier with the UNIX IPERF utility?
Use this software to create a live map of your network including the six routers and IP networks. Change the polling method to TCP/IP—SNMP since this provides more information than the default ICMP method. Edit the symbols on the map to abbreviate the router names such as “R1” and network names using the third octet of the IP network number. This will help give you more room to fit all the icons on the screen. Configure the system to poll the devices every 10 seconds (Make sure you are not polling any devices outside of the lab environment). If configured properly, you should be able to view the map where the icon color indicates the status (i.e. green=good) and you should also be able to right-click your mouse on the router icons to Telnet, Ping, Traceroute, etc., to the highlighted device.
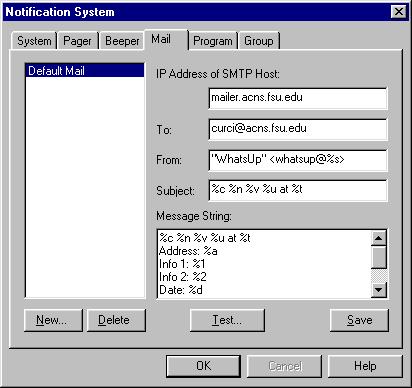
Configure the system such that if any of the routers go down on weekdays between 9am and 5pm, the system will send you an automatic e-mail message.
Configure the system to implement a WWW server such that you can check the status of your network remotely with the use of a web browser.
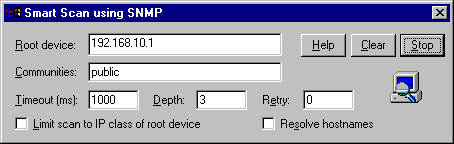
Hint: The “discover devices/intelligently scan network devices with SNMP seed router” function may save you time to initially build your map.
This Windows 95/98/NT/2000 utility is currently one of the most popular network management packages available for small networks. Many of the tools used under Linux in previous exercises have similar counterparts in this package but tend to be less functional. It also includes the ability to build a map to display the network status and poll devices with SNMP. It can implement a web server to make the status visable remotely via web browser. It also has hooks to allow notifications to create sounds, send e-mail, activate a digital or alphanumeric pager, etc.
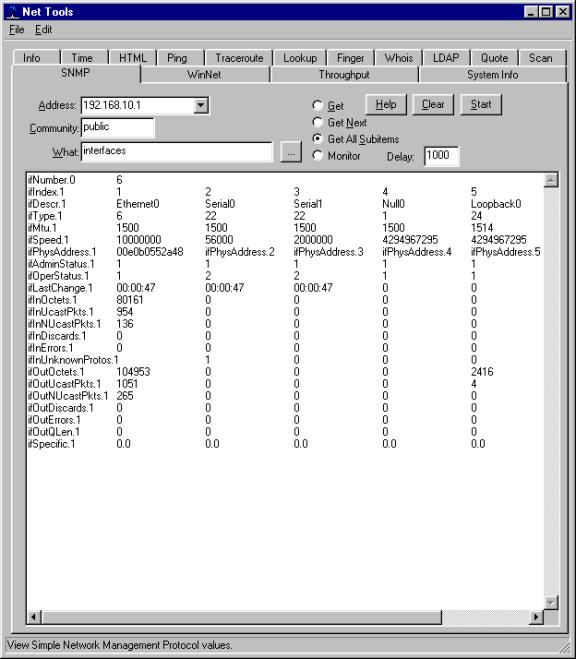
The SNMP tool has a nice display. Here is an example where we fetch the interface statistics. Note the tabs on the top of the display list the large number of network tools:
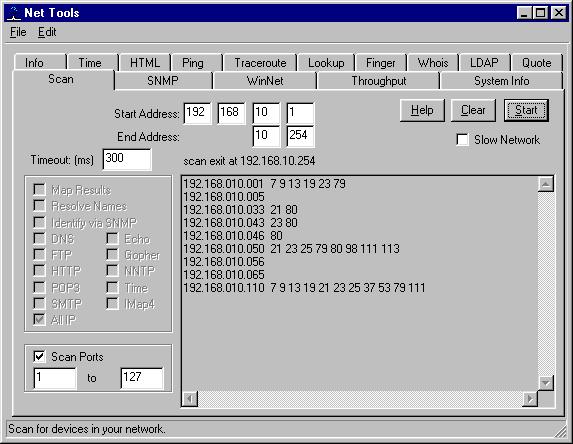
The Network Scan tool is not nearly as fast or powerful as NMAP. For example, it cannot do a stealth scan, or guess the operating system of the target computer. It can, however, do simple TCP scanning to look for well known port numbers. The port numbers with TCP services for each located host are displayed as a list of integers:
The smart snmp scan function is the fastest way to build a map. You give the system the address of a seed router. The discovery program recursively looks through the IP routing table part of the MIB and the next hop addresses are other routers that are polled. Normally you get a very ugly map and need to manually rearrange the icons and remove extraneous information. In my example below, the discovery probe went right past the firewall and found the Computer Science router.
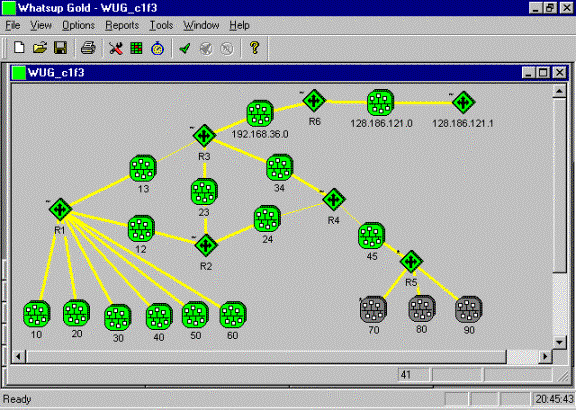
Here is an example of what the network graph should look like after cleaning it up by hand. I ran out of space on my 640x480 VGA monitor so abbreviated the names and deleted unimportant parts like the loopback address networks.
Below you can see some of the configuration screens for setting up e-mail notifications. The system sends information in the subject field and body of the message.
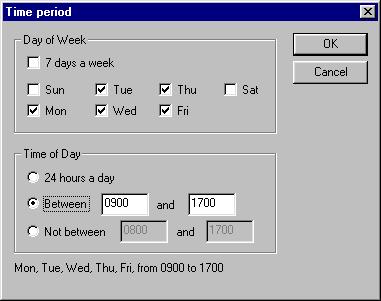
Here you can specify which days and times you are to be alerted. The example below configures the system to alert only on weekdays between 9am and 5pm.
…